
TOWARD AN INTEGRATED RISK–RETURN APPROACH IN PERFORMANCE ATTRIBUTION
AMINDIS Insights
Estimated reading time: 8min
Measuring the added value of portfolio management decisions and ensuring transparency with fund holders have become essential in a highly competitive industry. The quality of portfolio management is assessed through return calculations and performance ratios. These analyses are complemented by performance attribution, whose objective is to measure the contribution of each active management decision.
Traditional performance attribution models (Brinson, Hood & Beebower; Brinson & Fachler) decompose active return relative to a benchmark into an allocation effect (asset class or sector weighting decisions) and a selection effect (security selection decisions). However, these models evaluate returns only, without considering the risk incurred.
Yet, a decision may generate a positive active return while involving significant risk-taking. Such a decision may lead to an inefficient risk–return trade-off.
The purpose of this article is to propose an analysis of how active management decisions contribute to both return and risk.
This integrated risk–return analysis of active management enhances the relevance of performance reporting and strengthens the monitoring of management effectiveness.
RISK-RETURN PERFORMANCE ATTRIBUTION
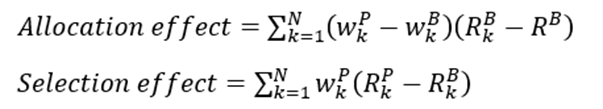
This model extends standard attribution approaches by incorporating risk into the analysis, to evaluate the efficiency of active decisions. Brinson-type models identify two categories of active decisions: overweight or underweight allocations to a portfolio segment relative to its benchmark, and security selection decisions differing from those of the benchmark. Segments typically refer to asset classes, sectors, geographic regions, etc. Active return is then decomposed into an allocation effect, a selection effect, and eventually an interaction effect between allocation and selection.
The central idea of the risk–return attribution model is to associate each contribution to risk with an expected return proportional to the market price of risk (measured by the Sharpe ratio). Indeed, the Capital Asset Pricing Model (CAPM) tells us that the expected return of an investment in a risky asset equals the risk-free rate plus a risk premium determined by the market price of risk multiplied by the asset’s contribution to market portfolio risk. CAPM allows us to assign to each active management decision its expected contribution to return, to be compared with its realized contribution. Of course, this presupposes that we can compute the contribution to risk of active management decisions.
Combining Brinson-type performance attribution with risk attribution¹ allows us to associate each active decision with an alpha coefficient—that is, a risk-adjusted active return.
RISK ATTRIBUTION
The total risk of a portfolio is generally estimated by the standard deviation of returns. Total portfolio risk equals the sum of the risk contributions of each segment; this contribution depends on the correlation of each segment’s return contribution with the portfolio return and on the volatility of those return contributions:

To isolate the risk contribution of allocation and selection decisions, we introduce an intermediate portfolio that uses the same segment weights as the actual portfolio but replicates the benchmark within each segment. This intermediate portfolio is therefore passive in selection and active in allocation.
The risk contribution of allocation decisions for segment k is then equal to the difference between the risk contribution of the intermediate portfolio and that of the benchmark:
Where P represents the portfolio, B the benchmark, and PB the intermediate portfolio.
This shows that the allocation effect results from the impact of over/underweighting on correlation and volatility. In the case of a constant overweight or underweight over the period ( ![]() = constant), the change in risk depends solely on changes in segment correlations with the portfolio—i.e., changes in diversification.
= constant), the change in risk depends solely on changes in segment correlations with the portfolio—i.e., changes in diversification.
The risk contribution of selection decisions corresponds to the difference between the portfolio under management and the intermediate portfolio (active in allocation but passive in selection):
This also shows that selection effects depend primarily on differences in volatility between portfolio segments and benchmark segments.
It can be demonstrated that the risk difference between a portfolio and its benchmark equals the sum of allocation and selection effects across all segments. It is therefore possible to decompose the portfolio–benchmark risk differential into an allocation effect and a selection effect.
In the next section, we will associate expected return with these changes in risk to determine the risk-adjusted return of active management decisions.
RISK-RETURN ATTRIBUTION
In this section, we focus solely on the Brinson and Fachler (1985) model. However, the approach applies directly to other attribution models, whether tailored to equity portfolios, fixed income portfolios, or mixed portfolios.
In this model, the allocation and selection effects are:
When weights vary over time, effects are computed daily and aggregated using linking methodologies². Realized allocation and selection effects over the period are compared with expected effects derived from risk attribution. Expected effects are proportional to the market price of risk (Sharpe ratio):
![]() and
and 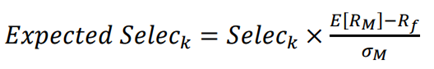
The terms Allock and Seleck represent the active contributions to risk from allocation and selection decisions. The term ![]() is the market price of risk, or the Sharpe ratio. The expected effects can therefore be interpreted as the risk contributions of active decisions expressed in return terms, using the market price of risk.
is the market price of risk, or the Sharpe ratio. The expected effects can therefore be interpreted as the risk contributions of active decisions expressed in return terms, using the market price of risk.
Alpha—or risk-adjusted active return—is the difference between the expected return of active decisions and the realized return:
![]() and
and ![]()
ILLUSTRATION
The table below presents sector weights and returns for a portfolio relative to its benchmark. The ALLOCATION and SELECTION columns show the performance attribution results using Brinson methodology (Ret), risk attribution (Vol), and expected return (E[Ret]), assuming a Sharpe ratio of 0.4.
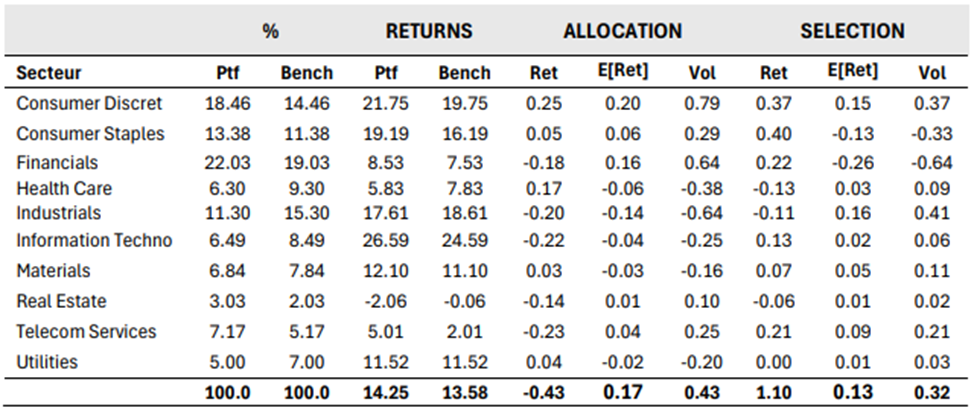
For example, in the Consumer Discretionary sector, the Brinson allocation effect of 0.25% results from a 4% overweight, invested passively at a return of 19.75%, while the benchmark return is 13.58%. Allocation decisions generated a risk contribution (Vol) of 0.79%, corresponding to an expected return (E[Ret]) 0.20% lower than the realized allocation effect. The alpha of this overweighting decision is therefore positive at 5 basis points.
At the overall portfolio level, allocation decisions contributed -0.43%, i.e., a negative allocation alpha of -0.60%. Conversely, selection decisions produced a positive alpha of 0.97%.
This analysis shows that, for this portfolio, allocation decisions negatively impacted the risk–return profile, while selection decisions contributed positively.
Although this example covers only a single period, the model can be extended to a multi-period framework. This would involve linking Brinson attribution effects across periods and computing correlations and volatilities based on historical series of return contributions rather than raw return series.
Incorporating risk into performance attribution significantly enhances the analysis of active management. Dynamic management may increase risks—through overweighting riskier sectors or selecting more volatile securities—and may deliver a positive return that is nevertheless insufficient to compensate for the risk taken. Standard attribution models focus solely on the return dimension.
Integrating risk into portfolio performance analysis strengthens the quality of reporting provided to fund holders and enables portfolio managers to better monitor the effectiveness of their decisions.
Search for a Blog post
Add new comment