
IMPACT, RISK, RETURN : SHOULD WE CHOOSE BETWEEN FINANCIAL PERFORMANCE AND ESG? CFA HORAN DISCUSSION.
Estimated reading time: 4min
HORAN, ITS LIMITATIONS… AND OUR ANSWER AT AMINDIS
Can a manager be judged solely on financial performance, ignoring ESG? Not anymore.
Can we, conversely, favor ESG without considering performance or active risk? Again, no.
At Amindis, we sought a simple, readable, and actionable approach.
Horan’s framework, which combines a performance ratio (like Sharpe) with an ESG quotient, opens an interesting path. But it suffers from some methodological weaknesses:
- Asymmetry: the result mixes metrics of different nature (returns and scores), making the output hard to interpret.
- Benchmark sensitivity: the more homogeneous the benchmark, the more inflated the quotient — and vice versa. It can be gamed.
- Heterogeneous units: if expressed in Tracking Error (TE), it combines a return (in %) with a dispersion (in points), compromising interpretability.
- Weak link to skill: a high quotient may simply reflect positioning choices, not true measurable skill.
OUR PROPOSAL : TWO AXES, TWO INDICATORS, ONE CLEAR READ
Rather than an opaque composite score, we suggest a 2D analytical grid, with two complementary dimensions:
Information Ratio (IR): measuring active return vs benchmark, adjusted for active financial risk.
ESG Quotient: measuring active ESG value creation, adjusted for ESG active risk.
This approach helps evaluate how well a manager maximizes ESG impact or financial return, under a constrained risk budget. It enables a fair assessment of skill: who delivers more value per unit of active risk?
On a simple 2D graph, managers can be plotted and compared across time.
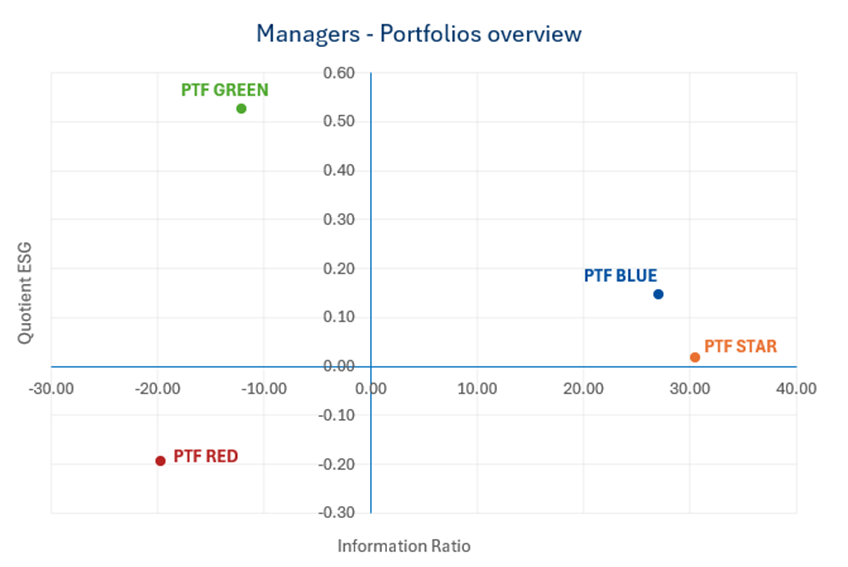
Figure 1. Portfolios overview on the Impact-Risk-Return grid
This leads to practical use cases:
- Profile managers: efficient, opportunistic, ESG-biased, passive followers, etc.
- Guide decisions: prefer managers delivering either strong return, strong ESG, or both.
- Track evolution: follow how a manager shifts in the IR/ESG plane over time.
Taking the Example of PTF Green:
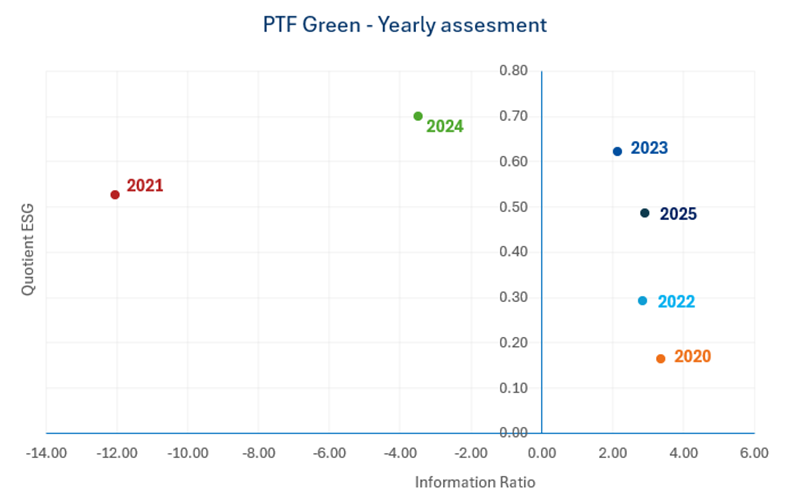
Figure 2. Yearly evolution of the Portfolio Green
From 2020 to 2021, the manager drastically reduced active risk (see Fig.3). However, he succeeded in generating a better ESG score, although this movement did not benefit financial performance.
In 2022, he increased active risk again, resulting in a considerable rebound in financial terms, but is less virtuous on ESG.
2023 is his best year of management: he significantly improved every dimension and even approached the benchmark in terms of risk.
In 2024, the manager appears to have found an ESG “maturity,” but suffered a notable loss.
In 2025, his ability to remain virtuous seems to stabilize and stay at similar previous levels, and he succeeds in recovering financial performance while keeping the risk budget under control.
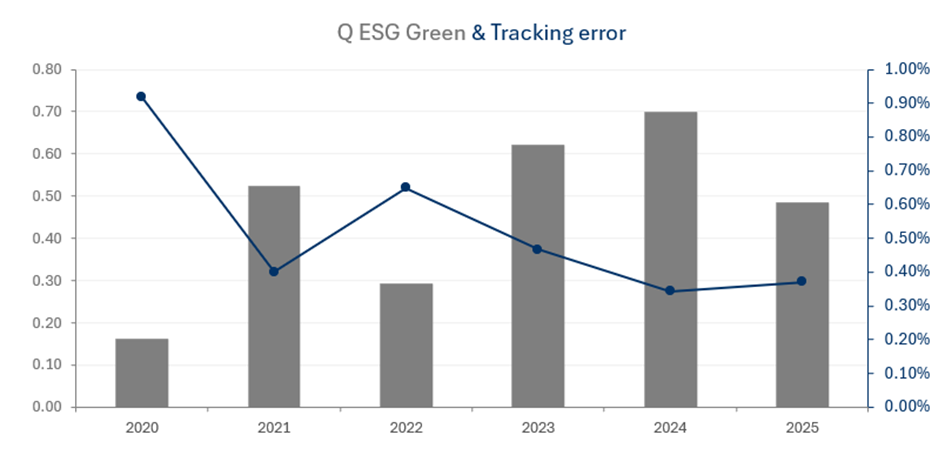
Figure 3. ESG Quotient and Tracking error of Portfolio Green
A CLEAR AND PRACTICAL VIEW FOR ALL STAKEHOLDERS
For the portfolio manager:
→ It becomes a management tool, demonstrating their ability to generate value under constraints.
For the investor:
→ It provides a synthetic reading, revealing an often-implicit trade-off: how much active risk for how much ESG value.
Our approach doesn’t oversimplify portfolio management — it clarifies its evaluation.
ESG data now allows asset managers to demonstrate new dimensions of expertise. It ensures transparency on the traditional return-risk pair, but introduces a three-dimensional evaluation: Impact, Risk, Return.
EXPLORE MORE ARTICLES
COMMON QUESTIONS ABOUT THIS TOPIC
Title
What is the Impact-Risk-Return framework?
It is a two-dimensional grid combining the Information Ratio and an ESG Quotient to assess both financial performance and ESG value creation under a defined active risk budget.
Title
Why is Horan's ESG Performance model limited?
Horan's model mixes heterogeneous metrics, is sensitive to benchmark composition, and may inflate results without reflecting true manager skill.
Title
How does the ESG Quotient help evaluate managers?
The ESG Quotient measures active ESG value creation per unit of ESG active risk, offering a clear view of how effectively a manager generates impact.
Title
How can the information ratio be used with ESG?
The Information Ratio captures active financial return versus active financial risk, complementing the ESG Quotient to show where managers stand on both performance and impact.
Title
What are the benefits of a 2D ESG-performance grid for investors?
It offers a transparent, comparable view of manager profiles, clarifies the trade-off between ESG and performance, and highlights who creates the most value per unit of active risk.
Add new comment