
CORRELATIONS: INDEX PRICES VS INDEX RETURNS, TWO READINGS OF THE SAME MARKET
AMINDIS Insights
Estimated reading time: 12min
Correlation is a cornerstone in portfolio management. It measures how assets move together, guides diversification, and feeds the covariance matrices used in risk models. Yet behind this seemingly straightforward concept lies a critical methodological choice: should we calculate correlation on price indices or on returns? The standard answer in academic finance is clear, but it is not without controversy.
THE ACADEMIC RULE: RETURNS
For decades, the dominant practice has been to compute correlations on returns. This preference stems from the concept of stationarity. A series is said to be stationary when its statistical properties - mean, variance - remain stable over time. Index prices, by contrast, are non-stationary: they follow trends, are highly autocorrelated, and their characteristics shift across cycles.
As early as Yule (1926) and later Granger & Newbold (1974), econometricians showed that using non-stationary series leads to misleading results, so-called “spurious correlations.” To avoid this, finance shifted to working with differences - i.e., returns. This approach was formalized in practice through the first RiskMetrics Technical Documents (J.P. Morgan, 1994), later embedded into MSCI Barra factor models, and implicitly or explicitly used in regulation (UCITS, Solvency II, Basel).
Mathematically, the logic holds. Returns are approximately stationary and comparable across assets, which makes variance–covariance matrices coherent. Return correlation has therefore become the backbone of both academic models and regulatory reporting.
A Too-Smooth Vision
In practice, however, return correlations turn out to be surprisingly stable. Over the past two decades, the correlation between the S&P 500 and a diversified portfolio has hovered between 0.8 and 0.9.
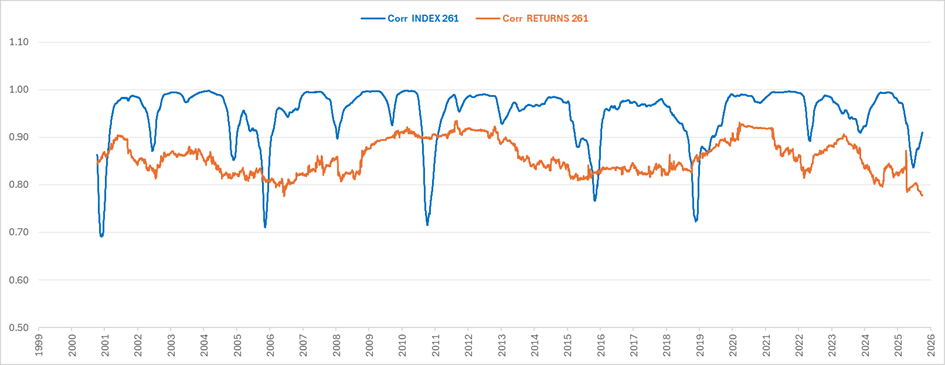
Figure 1. Rolling correlations between US Equities and a diversified portfolio (60% Equities – 40% Bonds).
Between equities and sovereign bonds, return correlations (see Fig. 2) have remained close to zero, giving the impression that no meaningful relationship exists. This produces a “smooth” view of markets—technically useful for risk engines, but poor at capturing the economic dynamics that matter to investors.
INDICES: THE MARKET’S BREATHING PATTERN
When correlations are calculated on index prices, the picture changes dramatically. Correlations swing and reset in line with crises and recoveries. In the early 2000s, during 2008, and again during corrections phases, equity–bond correlations turned negative as government bonds played their safe-haven role. During monetary easing cycles, correlations turned positive, as all asset classes were pushed in the same direction.
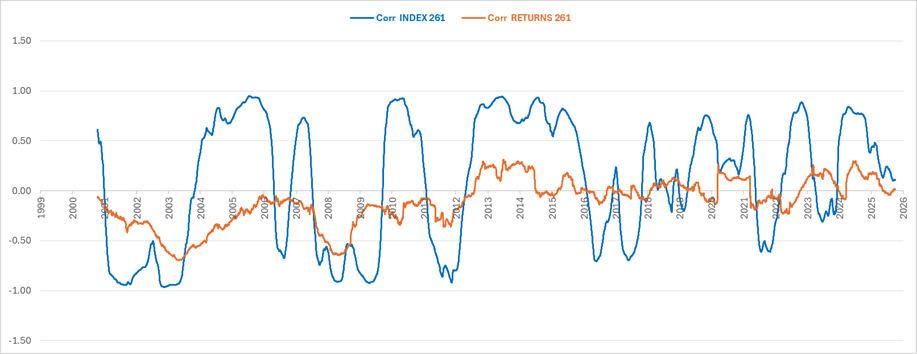
Figure 2. Rolling correlations between EU Bonds and EU Equities, 261 days basis.
This is not limited to Europe. The same patterns appear in the United States: between the US Equities and US Treasuries, prices correlations turn deeply negative in market crashes, then revert positive as the Fed injects liquidity and stabilizes markets. In other words, index correlations capture the universal breathing of the equity–bond pair.
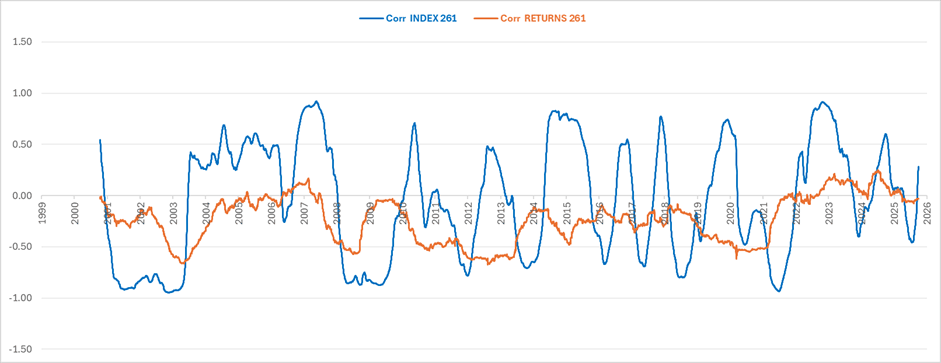
Figure 3. Rolling correlations between US Bonds and US Equities, 261 days basis.
A Striking Example
Beyond these empirical observations, the difference between prices- and return-based correlations can also be illustrated through a simple pedagogical example.
Imagine two series with exactly the same volatility. Their returns are perfectly correlated at +1. Yet, when these returns are compounded, the trajectories diverge completely: one collapses, the other soars. The correlation of indices comes out at –1.
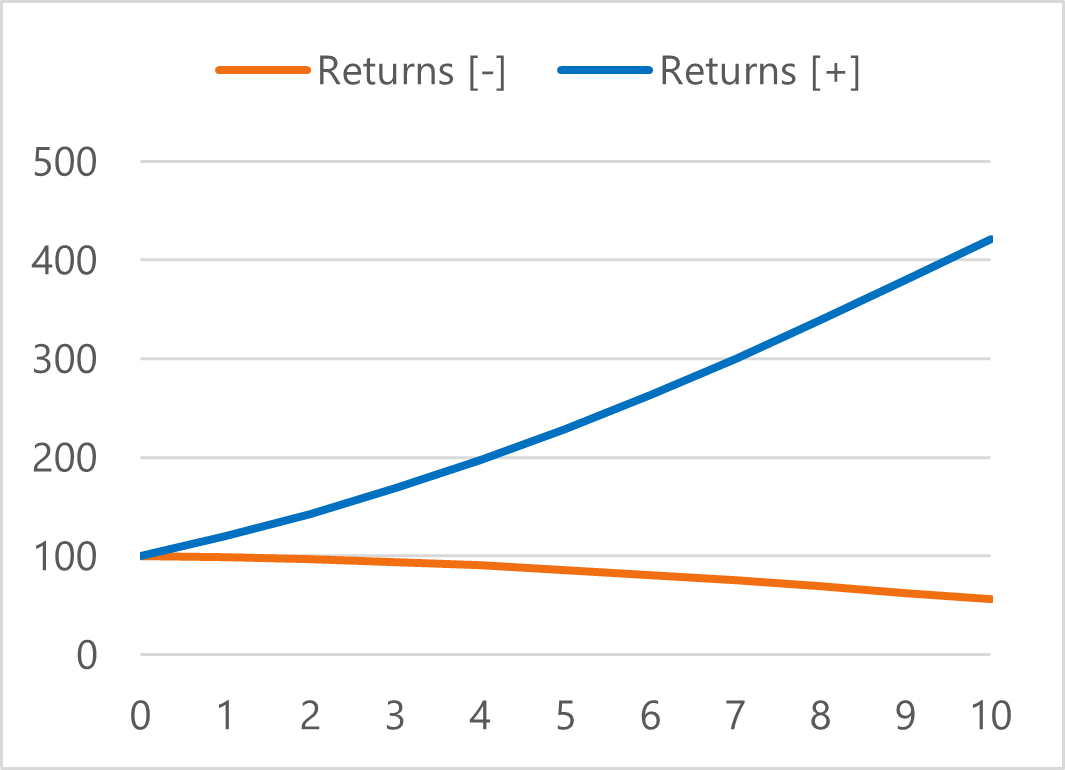
Figure 4. Portfolios values
This highlights a critical limitation of the “returns only” paradigm: high return correlation can tell an entirely misleading economic story, whereas index correlation reflects the visible reality of portfolio trajectories.
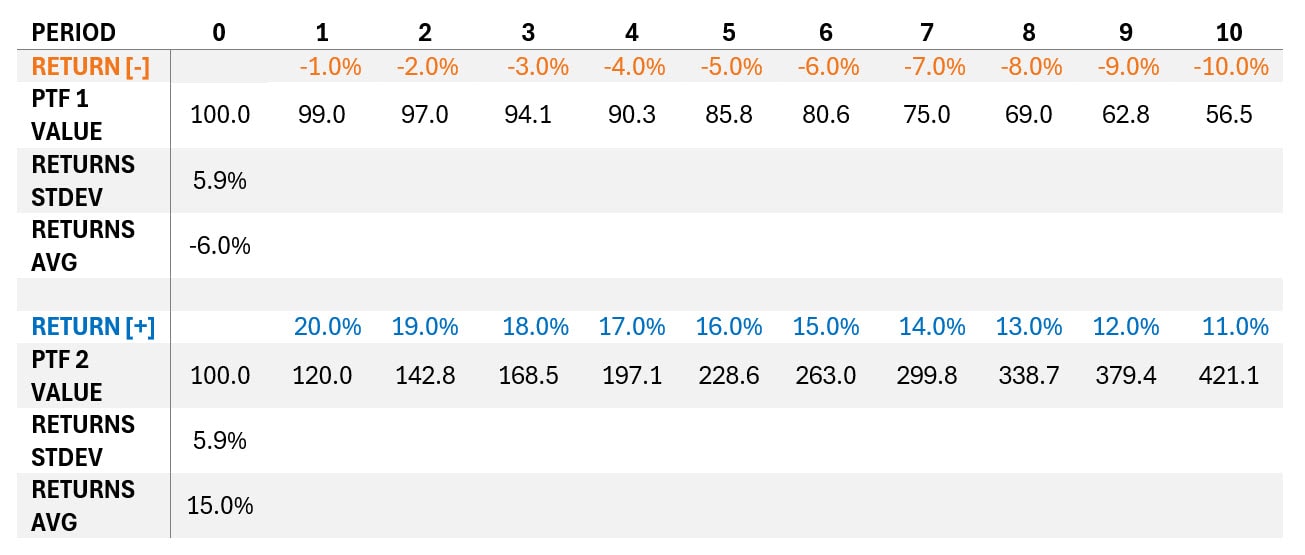
This raises a simple but essential question: how meaningful is a high statistical correlation when the portfolio’s trajectory has diverged so sharply from its benchmark in economic terms?
Rolling Returns: The Intuition
Rolling one-year returns make the intuition even clearer. During equity drawdowns, government bonds have historically tended to provide a stabilizing effect - though this pattern weakens in inflation-driven or rate-tightening regimes - pushing index correlation deep into negative territory. In liquidity-driven rallies, all asset classes rise together, and correlations swing back positive. Day-to-day returns smooth out those swings, erasing the dynamics that matter most to practitioners.
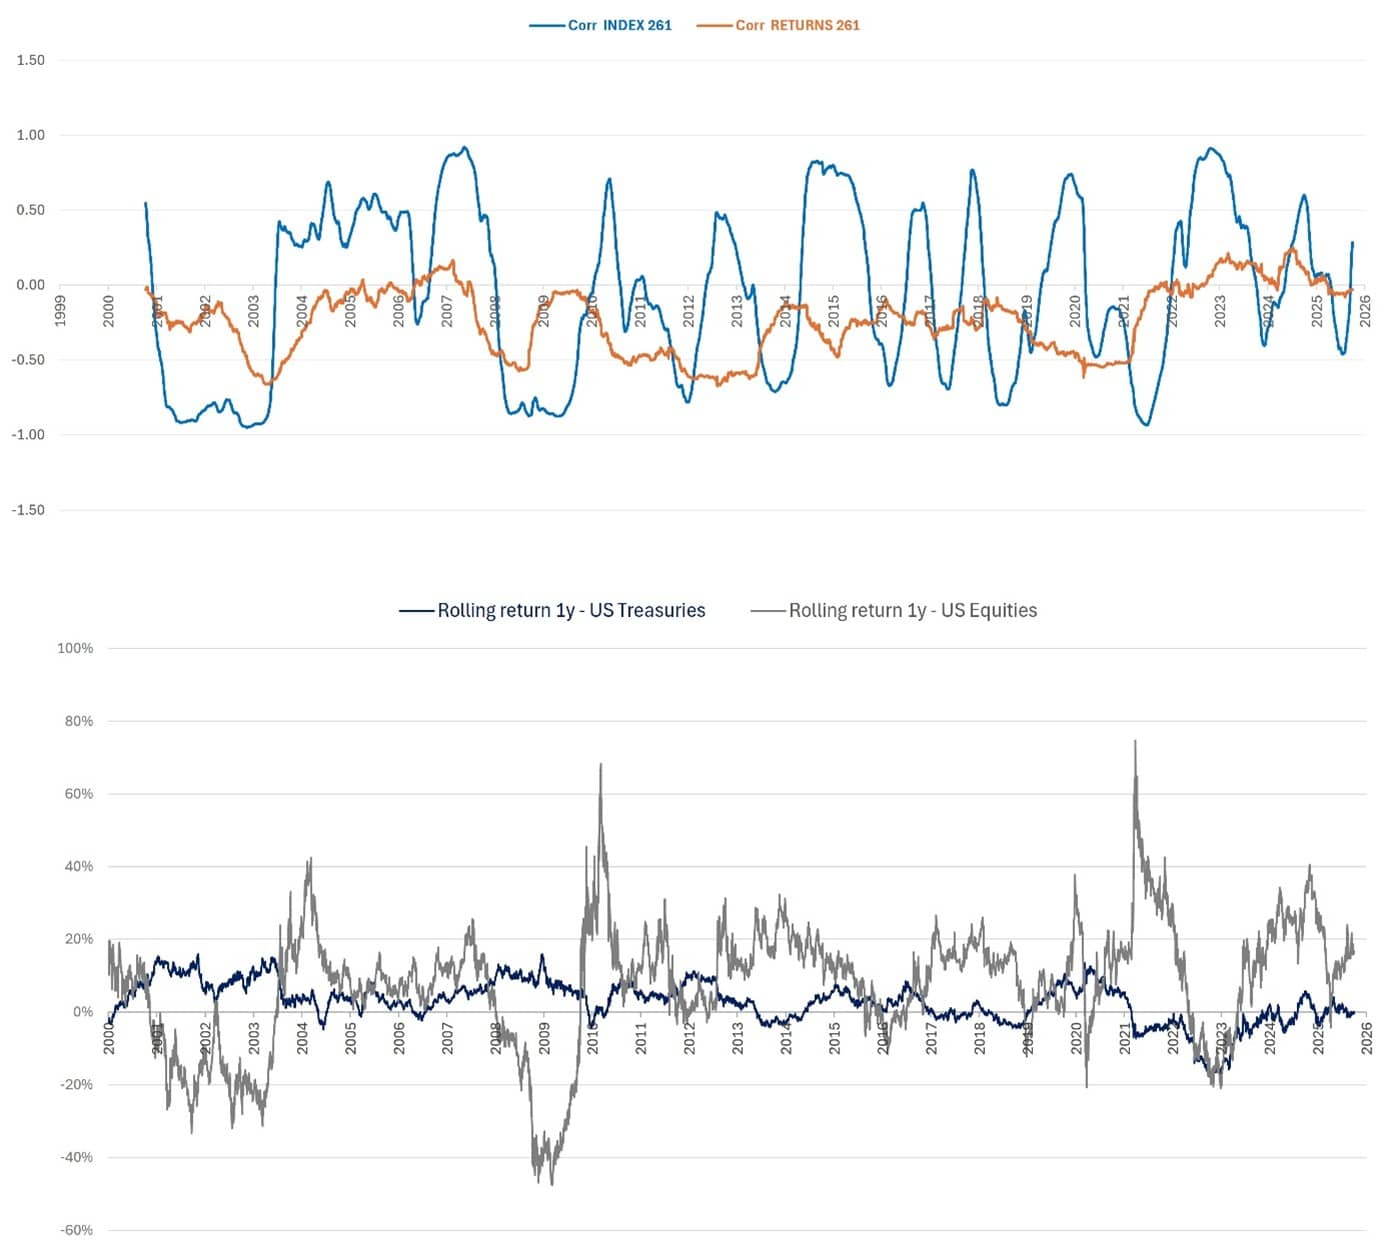
Figure 5. Rolling correlations between US Bonds & US Equities (first), and rolling returns 1y of both asset classes
A DUAL USE FOR INVESTORS
Does this mean we should abandon return correlations? Certainly not. They remain essential for quantitative models and for regulatory compliance. But they are not sufficient. Index correlations, though imperfect from a statistical standpoint, provide invaluable economic insight. They show investors when diversification genuinely protects, and when it ceases to play its role.
The academic caution against non-stationary correlations is valid when the series are random and independent. But in financial markets, indices are not random walks — they are co-integrated, economically linked series evolving through asynchronous cycles. In such cases, index correlations reveal genuine regime shifts that return correlations systematically erase.
Correlating returns means adhering to academic rigor and regulatory standards. Correlating index prices means bringing data to life and understanding the market’s breathing cycle. The two approaches are not mutually exclusive; they are complementary: returns are for calculation, prices are for understanding, arbitrage, and communication.
USEFUL SOURCES
- Yule, G. (1926). Why do we sometimes get nonsense correlations between time series? Journal of the Royal Statistical Society
- Granger, C. & Newbold, P. (1974). Spurious regressions in econometrics. Journal of Econometrics, 2(2), 111–120.
- J.P. Morgan (1994). RiskMetrics Technical Document.
- MSCI Barra Risk Models (1990s–2000s). Factor model methodology for asset covariance.
- Johansen, S. (1991). Estimation and Hypothesis Testing of Cointegration Vectors in Gaussian Vector Autoregressive Models.
EXPLORE MORE ARTICLES
COMMON QUESTIONS ABOUT THIS TOPIC
Title
Why calculate correlations on index returns instead of index prices?
Because return series are more likely to be stationary, making variance-covariance matrices valid. Using prices (non-stationary) can lead to misleading, spurious correlations.
Title
What does correlation on index prices reveal that return-based correlation doesn’t?
Correlation on prices captures the asset class “breathing” cycle—crisis vs recovery swings—showing when diversification actually fails or works in economic terms.
Title
Are price-based and return-based correlations mutually exclusive?
No—they are complementary. Return-based correlation remains essential for quantitative modelling, while price-based correlation adds economic insight.
Title
How can price-based correlation affect portfolio risk management?
It can signal when historically low diversification suddenly disappears (e.g., during crises) and prompt asset managers to review allocations or hedges accordingly.
Title
Which approach is more relevant for regulatory and modelling purposes?
Return-based correlation is still the standard for regulation (e.g., Solvency II, MSCI Barra models) and risk-engine frameworks due to statistical rigor.
Add new comment