RISK-RETURN ATTRIBUTION
Understanding the true efficiency of active management
Active management is judged on its ability to generate value beyond the benchmark. Asset managers and asset owners report allocation effects, selection effects, and excess return. Yet these numbers often hide a crucial dimension: how much risk was taken to achieve them.
Brinson attribution tells you what worked, but not whether it worked efficiently. A positive effect can hide a weaker diversification or an unnecessary rise in risk. Without linking decisions to the change in risk, it becomes difficult to assess whether the performance delivered is truly consistent with the risk taken.
In today's environment—where transparency, governance, and client communication are critical—measuring efficiency, not just performance, has become essential. This where Risk-Return Attribution, developed by AMINDIS, brings a decisive advantage.

A UNIFIED RISK-RETURN ATTRIBUTION MODEL
Active decisions create performance, but they also reshape risk. AMINDIS connects both dimensions to reveal how each decision contributed, what return it should have delivered, and the alpha it truly generated.
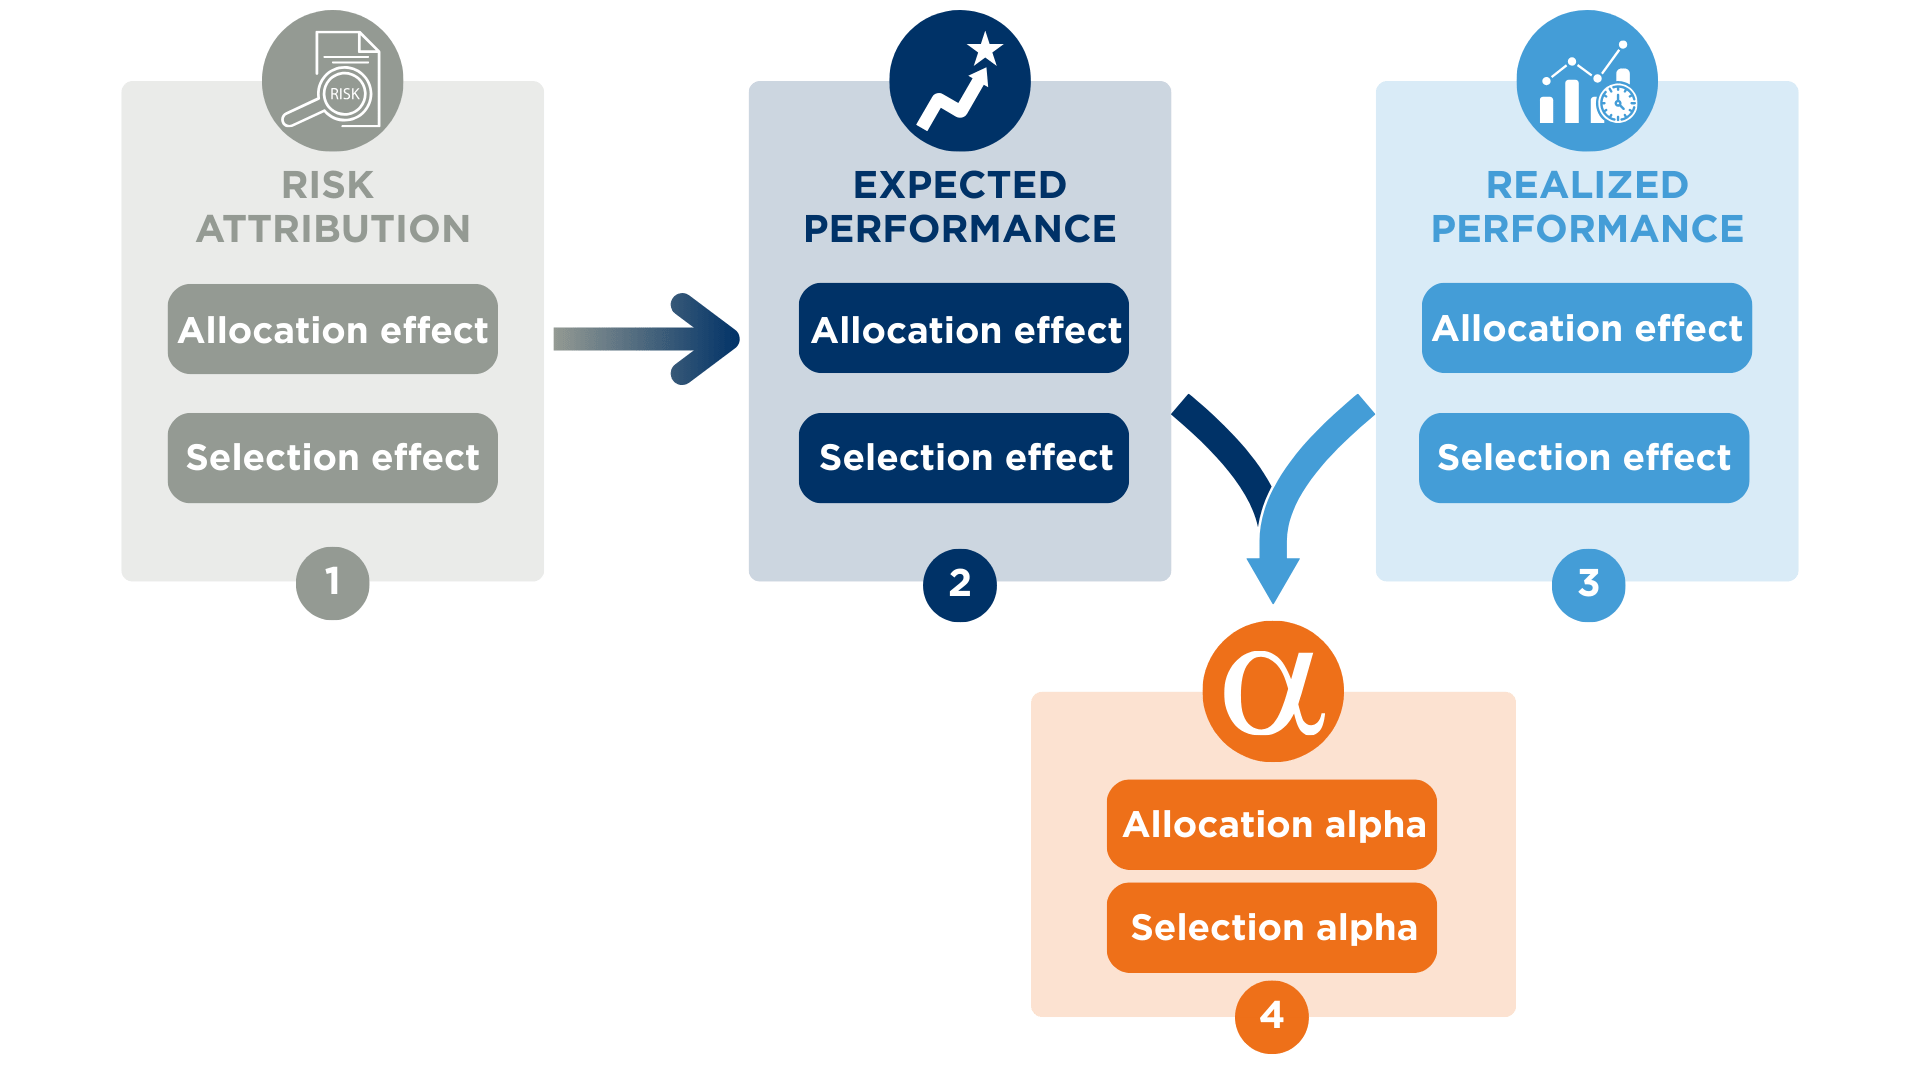

Risk attribution
Risk attribution shows how active decisions modify the portfolio’s risk profile.
AMINDIS measures each segment’s marginal impact using correlation and volatility of contribution to return—highlighting changes in diversification and risk contribution.
By comparing the portfolio with a synthetic version using benchmark securities, we isolate allocation risk from selection risk. It’s a fast, intuitive way to understand the real impact of active choices.

Expected performance
Once the risk impact is known, the next question is simple: what return should this risk have generated?
AMINDIS translates each risk contribution into the return it should have generated, given the market’s price of risk.
More risk = higher expected return. Less risk = lower expectation.
Efficiency becomes measurable, not subjective.

Realized performance
Real performance comes from the Brinson model and captures the pure effect of active decisions—sector positioning, allocation decision, and stock picking—without considering the risk behind them. It shows how these decisions contributed to excess return in absolute terms.
When compared with expected performance , this realized effect reveals whether the return delivered was merely in line with the risk taken or truly exceeded what that level of risk should have produced.

Alpha
Everything converges into alpha:
Alpha = Real performance – Expected performance
Positive alpha shows decisions created value beyond the risk taken.
Negative alpha means the decision took more risk than the return can justify.
To illustrate the model, the table below shows how a portfolio’s active decisions translate into risk contributions, expected performance, realized performance, and ultimately risk-adjusted alpha.
Reading it allows investment teams to see how an overweight, underweight, or stock-picking decision modifies diversification, impacts expected return, and reveals whether the final outcome was truly efficient.
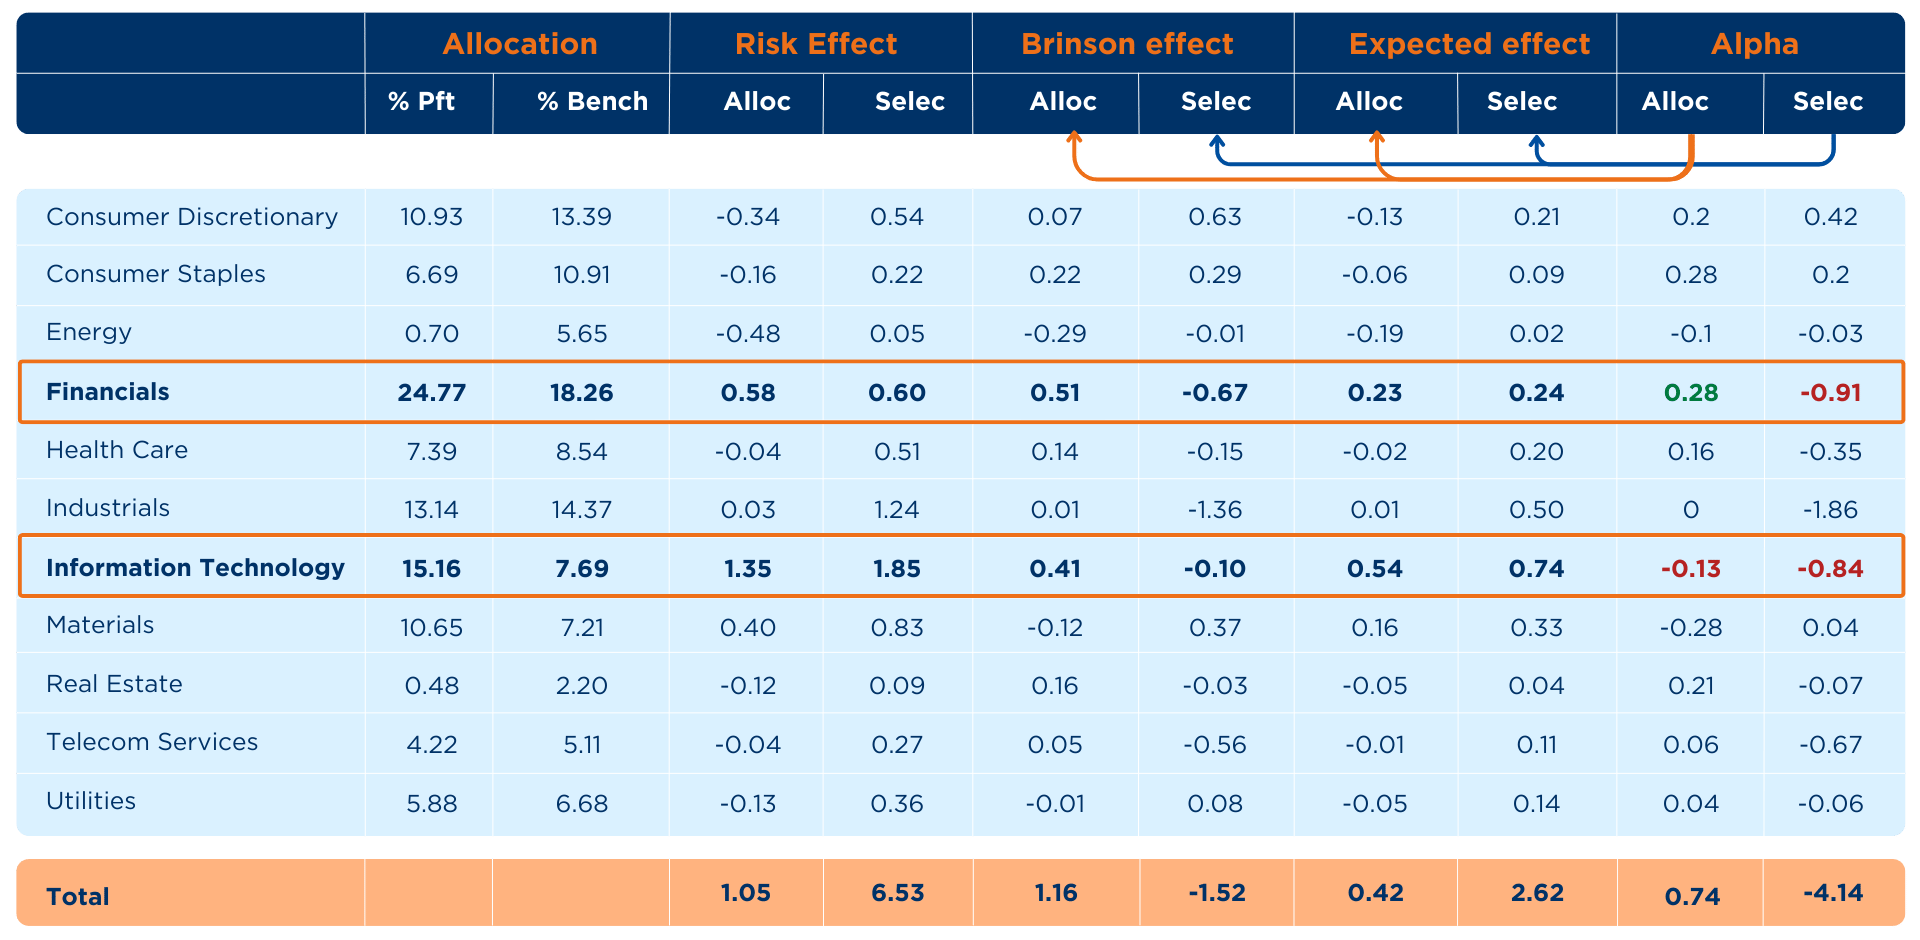
The two highlighted sectors illustrate how risk-return attribution distinguishes efficient decisions from those that did not compensate for the risk taken.
In Financials, the overweight generated a solid allocation alpha, showing that the additional risk was rewarded, while stock selection underperformed and produced a negative selection alpha.
In Information Technology, both allocation and selection carried significant active risk, but the realized returns fell short of expectations, leading to negative alpha on both dimensions.
These examples show how the model reveals whether performance is truly coherent with the risk assumed.
KEY BENEFITS AT A GLANCE

ASSESS VALUE CREATION
Calculate the effective value created by the strategy, beyond what the level of risk alone would justify.

CONTROL DIVERSIFICATION
Measure how each active choice changed the portfolio’s risk profile.

ENABLE TRANSPARENT COMMUNICATION
Deliver more transparent insights that support stronger, more trusted client relationships.
EXPLORE MORE: RELATED TOPICS
FROM INSIGHT TO IMPLEMENTATION: EXPLORE THE RIGHT MODULE
These modules form the core foundation to help you implement your processes efficiently and with precision.


TAKE THE NEXT STEP
Bring consistency, clarity, and transparency to your risk management process.
With AMINDIS, monitor today's exposures, simulate tomorrow's scenarios, and communicate your results with confidence.
Discover how our integrated platform helps you see risk from every angle—past, present, and future.